
Robinson Analytics Democratic and Republican Conventions Analysis
Since this is a presidential election year, thought I would weigh in with my take on the Democratic and Republican conventions. This will give us additional insight into the presidential race and how things are going. To get a sense of my latest insights on the race overall, access Robinson Analytics 2020 Presidential Race Center website by clicking here.
Robinson Analytics has commissioned a national poll around the November 3rd presidential election. As of Monday August 31st, 83% of Americans think the election will be a contested election (Think mail-in ballots). I will talk about this in my Robinson Analytics Investment Newsletter and give you stock market implications and strategies to profit from it. I use Data Science and apply it to the Stock Market to provide you with some of the highest-return investment ideas. To get these insights, subscribe to the newsletter by emailing me at arobinson@robinsonanalytics.com.
In this analysis, I compare the viewership of the conventions versus 2016, and how the conventions compare between the two . I also do some Google Trend comparative analysis of the candidates and break down the results by all 50 states.
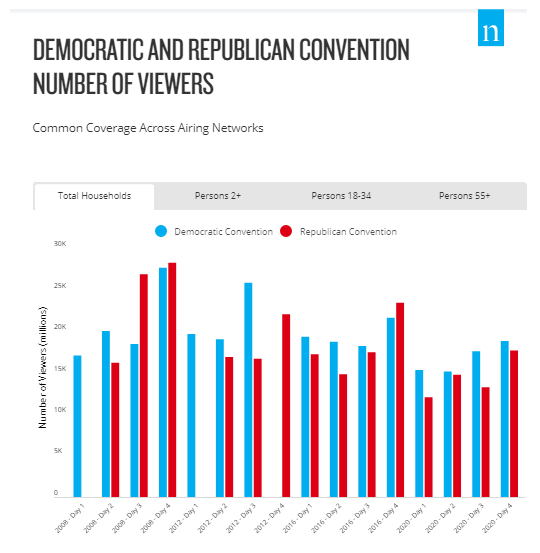
Donald Trump’s acceptance of his party’s nomination for president drew the biggest ratings of the 2020 Republican National Convention, but it came in well behind the 2016 gathering. His acceptance speech also trailed that of Joe Biden at the Democratic convention last week.
The six major networks covering the convention at 10 p.m. ET Thursday averaged 19.85 million viewers, topping the 18.02 million for Tuesday’s coverage for the biggest audience of the RNC.
It was down by more than a third — 34 percent — from Trump’s acceptance speech at the 2016 convention. On that night, 30.22 million people tuned in across the same six networks: ABC, CBS, NBC, CNN, Fox News and MSNBC. Trump’s speech also trailed the final night of the Democratic convention last week, which averaged 21.78 million viewers on the same six outlets.
When I take a look at the Nielsen ratings data, that reflects both Democrat and Republican 2020 conventions, the Democrats out performed the Republicans in terms of viewership as measured by Nielsen. See the table below.
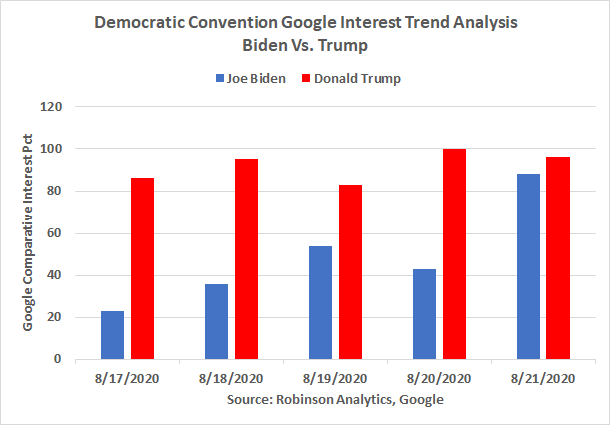
However, when I do some Google Trends interest analysis, some further differences do start to emerge. I took a look at American’s interest in Vice President Biden and President Trump during the Democrat convention. I found it quite interesting that there was more interest in President Trump than Vice President Biden during the Democratic convention according to Google. However, the Democratic convention’s interest was the highest when Biden spoke. Which correlates with the TV viewership data from Nielsen. See the chart below.
That tells me that there is something going on with the American electorate that is not being reflected in the Nielsen viewership and polling data.
When I took a look at the Google Trends interest in all 50 states, to get a look under the hood so to speak, President Trump had more interest in each and every state during the Democratic convention than Vice President Joe Biden. Even in the state of Delaware, the home state of Biden. Again, this tells me that there is something going on with the American electorate that is not being reflected in the polls or viewership data. See the table below.
It looks like President Trump performed the best in Kansas and West Virginia. Whereas, Vice President Biden performed the best in Delaware and Washington, D.C.
| Region | Joe Biden: (8/17/20 – 8/21/20) | Donald Trump: (8/17/20 – 8/21/20) |
| District of Columbia | 44% | 56% |
| Maine | 32% | 68% |
| Minnesota | 31% | 69% |
| Vermont | 34% | 66% |
| Oregon | 32% | 68% |
| Wisconsin | 34% | 66% |
| Washington | 34% | 66% |
| New Hampshire | 33% | 67% |
| Pennsylvania | 36% | 64% |
| Massachusetts | 36% | 64% |
| Iowa | 31% | 69% |
| Delaware | 46% | 54% |
| Rhode Island | 33% | 67% |
| Maryland | 36% | 64% |
| New Jersey | 36% | 64% |
| Michigan | 35% | 65% |
| Connecticut | 37% | 63% |
| West Virginia | 30% | 70% |
| Ohio | 34% | 66% |
| Colorado | 36% | 64% |
| Illinois | 34% | 66% |
| New Mexico | 34% | 66% |
| Arizona | 34% | 66% |
| Idaho | 35% | 65% |
| Virginia | 35% | 65% |
| New York | 35% | 65% |
| Montana | 32% | 68% |
| Florida | 35% | 65% |
| Missouri | 33% | 67% |
| Nevada | 33% | 67% |
| Wyoming | 34% | 66% |
| Nebraska | 35% | 65% |
| Kansas | 30% | 70% |
| California | 35% | 65% |
| North Dakota | 37% | 63% |
| Alaska | 32% | 68% |
| South Dakota | 37% | 63% |
| Arkansas | 32% | 68% |
| Hawaii | 36% | 64% |
| North Carolina | 34% | 66% |
| Oklahoma | 35% | 65% |
| Tennessee | 36% | 64% |
| Kentucky | 35% | 65% |
| South Carolina | 36% | 64% |
| Utah | 34% | 66% |
| Indiana | 35% | 65% |
| Georgia | 35% | 65% |
| Louisiana | 34% | 66% |
| Texas | 35% | 65% |
| Alabama | 33% | 67% |
| Mississippi | 39% | 61% |
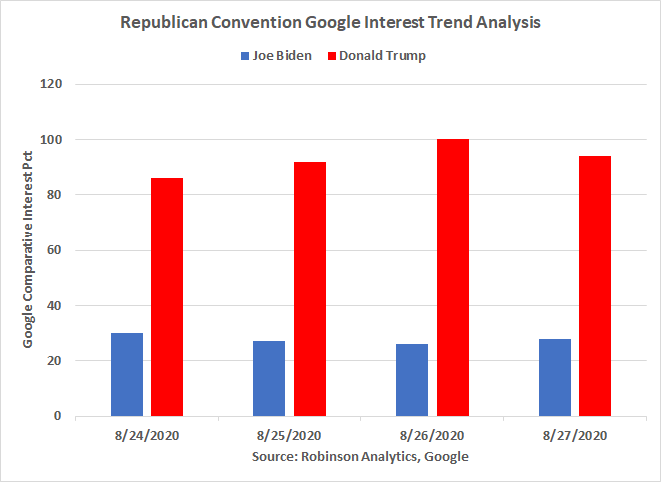
When I did the same Google Trend analysis on the Republican Convention, President Trump bested Vice President Biden every night of the Republican convention in terms of interest. Which you would expect.
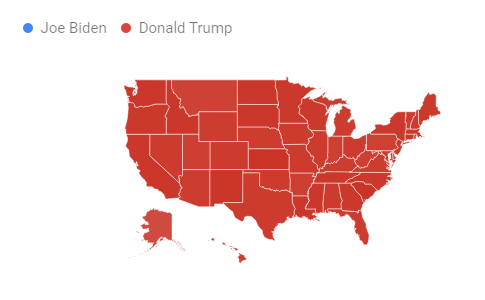
As you can see from the map below, President Trump came in with the best Google interest ranking in every state during the Republican convention.
In summary, it looks like both parties experienced reduced viewership of their conventions. It looks like the Democratic convention bested the Republican viewership according to Nielsen. However, there does seem to be more interest in President Trump than candidate Joe Biden during both of these conventions. Which I don’t think is currently being reflected in public polling.
“We use analytics on your work and business processes to gather the critical insights that you need to impact your business performance.” Click here to schedule a complimentary discussion session about how Robinson Analytics can help you. To learn more, you can access his website at www.robinsonanalytics.com.